Statistical analysis of test item data is useful for faculty to achieve valid and reliable assessment instruments in order to appropriately measure student performance. Data elicited from this type of analysis contains information essential for identifying strengths and weakness of the instrument.
The figure below shows an example of an item analysis report from ExamSoft (Note: Question stem and answers redacted):
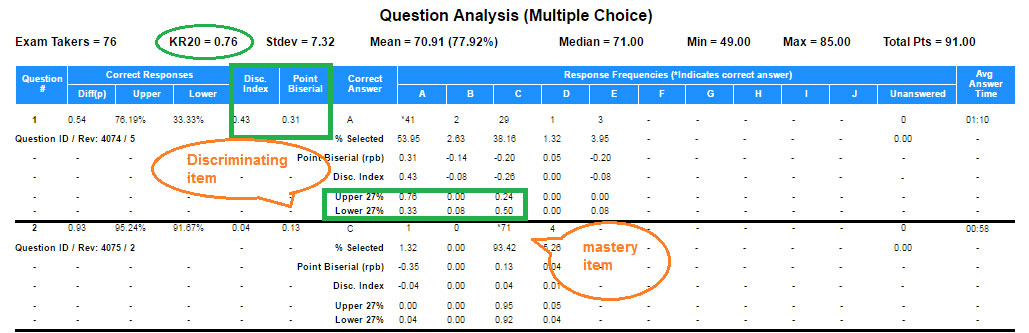
Click the image to enlarge
KR-20
- Used as an overall measure of reliability for an assessment.
- KR-20 ranges from 0.0 to 1.0; the closer to 0 indicates a very poor reliability and closer to 1.0 indicates high reliability.
- Value is influenced by several factors.
- Number of questions on the assessment (>50 is ideal).
- Number of students taking the assessment.
- Multiple correct answers.
- The fewer number of questions, fewer number examinees, and multiple key adjustments will almost always lead to a misleading and low KR-20 value.
- KR-20 may not be useful if exams are not reused every year. In general a KR-20 >0.50 is acceptable with at least 30 exam takers, 50 items, and only one correct answer for each item.
General guidelines for ExamSoft statistical interpretation are as follows:
Item Difficulty – Acceptable item difficulty is how many exam takers answered the item correct. There is no a set number; the item difficulty must be taken into account with the point Biserial and discrimination index. If the intent is a mastery item, a difficulty level between 0.80 and 1.00 is acceptable. If the intent is a discriminating question, a range of 0.30 to 0.70 is generally acceptable.
Discrimination index – This value is based on the top 27% and bottom 27% of the class on the exam. Computed by subtracting the number of successes by the low group on the item from the number of successes by the high group, and divide this difference by the size of the class. Ranges from -1.0 to +1.0; the closer to 0.0 indicates no discrimination among high- and low-performing students. Achieving closer to 1.0 discrimination index is optimal. A discrimination index of 0.3 or greater is considered highly discriminating.
- Note: Item discrimination indicates the extent to which success on an item corresponds to success on the whole test. Any item with negative or zero discrimination will affect the discrimination of an assessment.
Upper 27 percent – If less than 60 percent of the top of the class answers correctly, further analysis is needed to determine issues with the question. A red flag for an erroneous item is when fewer of the upper 27 percent answer the item correctly than the lower 27 percent.
Lower 27 percent – This value should never be higher than the upper 27 percent of the class. As low as 0 percent can be acceptable as high as 100 percent can be acceptable if it is a mastery question.
Point-Biserial – The point-biserial correlation is the Pearson correlation between responses to a particular item and scores on the total test (with or without that item). The Biserial Correlation models the responses to the item to represent stratification of a normal distribution and computes the correlation accordingly. Like the Discrimination Index the range is -1.0 to 1.0. Generally 0.2 and above is considered to have high correlation and positive association with overall performance on the assessment; lower levels are acceptable for mastery; and 0.3 or higher are best for discriminating questions.
Sources
- Ermie, E. (2017, June). Psychometrics 101: Know what your assessment data is telling you. Slides presented at the ExamSoft Assessment Conference 2017, Denver, Colorado.
- Creighton University. (2017).
- Institute for Objective Measurement. (2017).